I finally got around to test driving NDepend today, and I must say it's pretty slick. I'm sure there is a ton more stuff it can do than what I've found so far, but here is a quick synopsis...
Starting it up is easy, simply start a new project or select "Analyze a set of .NET assemblies". Once that is done, however, the main screen can be a bit overwhelming. (TIP: Watch the videos on the NDepend site http://www.ndepend.com/GettingStarted.aspx) However, if you want to dive right in, hopefully this will help. Actually, it's pretty cool.
To get started, fire up VisualNDepend.exe. When you create a new project, there is an option to Add Assemblies of a Visual Studio Solution.

This will load all of your application assemblies on the left and your dependent assemblies on the right (including the requisite system assemblies).
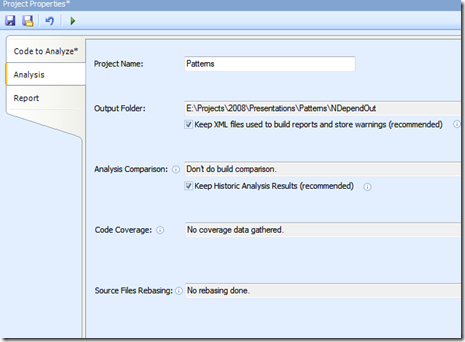
The analysis tab allows for setting up some project options (probably could be call Project Options, but it's just semantics). The cool stuff here is if you run NCover like I do, you can specify the coverage file so you get it all in the analysis.

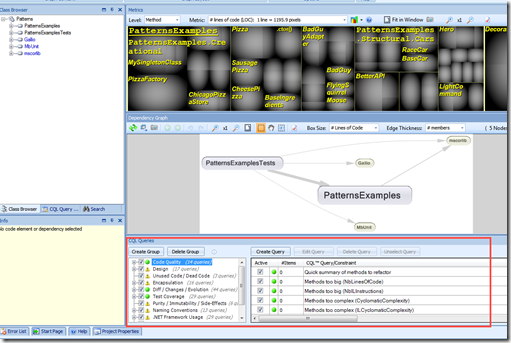
Once setup, click "Run Analysis". This loads up a web page with the summary, but also gets you to the screen shown here (admittedly hard to read):

Here's the key for me. Focus on the CQL section at the bottom (highlighted in the red box). This is a list of queries for your code. The out of the box groups are:
- Code Quality (14 sub queries)
- Design (17 sub queries)
- Unused Code / Dead Code (3 sub queries)
- Encapsulation (16 sub queries)
- Diff / Changes/ Evolution (44 sub queries)
- Test Coverage (29 sub queries)
- Purity / Immutability / Side-Effects (6 sub queries)
- Naming Conventions (13 sub queries)
- Statistics (12 sub queries)
- Samples of Custom Constraints (20 sub queries)
- Constraints extracted from Source Code (0 sub queries)
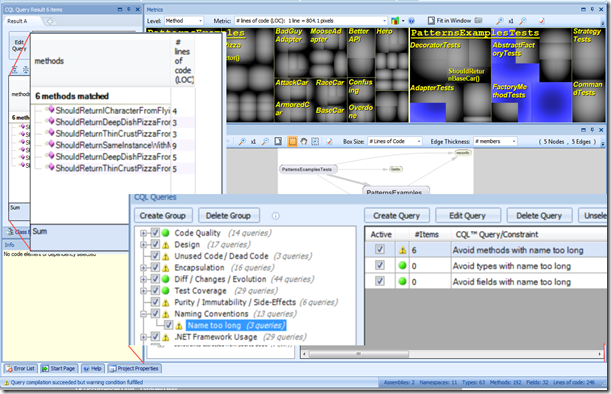
When you select one of the queries, you get detailed information about your code base. Here I clicked on the "Name Too Long" query, and it determined that my test names are too long. In the Metrics Matrix Window (top right) you get color coding of the code base for hits on that particular rule. Interesting graphic, but not that useful by itself, until you double click on the blue. It then loads up your code in Visual Studio! (I would prefer it to load my solution as well, but maybe that's a setting I haven't tweaked yet). Same goes for the list on the left referred to as the Code Tree window). Single clicking on the method name gives you additional information in the Info Viewer window just below the code tree.

As I was clicking around, I saw that several of their default rules don't match our coding standards (e.g. the "m_" prefix rule). Fortunately, the rules are cake-easy to edit and modify for your organizations standards. Rules can be disabled and additional rules can be added as well.
So, the question I have to ask, and you should be asking yourself, is "Do I have time to code review all of the code that I should be code reviewing?". If your schedule is like mine, than the answer is "Absolutely not." If your answer is "Yes", then I have to ask "How do you find the time?" and "Couldn't you be doing something more productive?"
Bottom line (for me) is this. NDepend will help find those sections of code that need a code review so you don't have to waste time sifting through your entire codebase to do code reviews, or (worse) throwing darts at the wall to decide.
If you value your time and your code quality, get a copy, and start using it. Does it do more than this? I'm sure it does. But does it need to?
Happy Coding!
e83d3b74-5e87-4f75-b813-f0fe844f88d9|0|.0|27604f05-86ad-47ef-9e05-950bb762570c